Watch the Video:
For this project, I used Refinery, an optimization node that contains a Multi_objective optimization algorithm.
In this project 2 shading parameters are controlled in Dynamo.
1. Opening factor
2. Width factor (B_factor)


For the mass model, a simple cylinder is considered and the adoptive components (shading panels) are mapped to the surrounding surface of the cylinder.


1. Exporting the coordinates of the panels using exporting data node in Dynamo.
2. Open a new project and load the desired adaptive component to the project
3. Import the edited SAT file using Dynamo.

4. Getting access to the parameters of the adaptive component by name

To get the parametric values for the opening factor, the following steps are done:
1. Find the normals of each panel

In this step instead of using the Revit sun path, a sun vector is simulated in Dynamo using sun position information in Revit. The reason is to use those variables as input for Refinery optimization.

3. The angle between the sun vector and normals of the panels are then calculated through dot product and the values are remapped to be used as opening factor value

The same values are used for overriding the colors of the panels based on the angle between the normals and the sun vector.


1. Drawing a mass model in the Revit project. This model is considered as the adjacent building to my project.
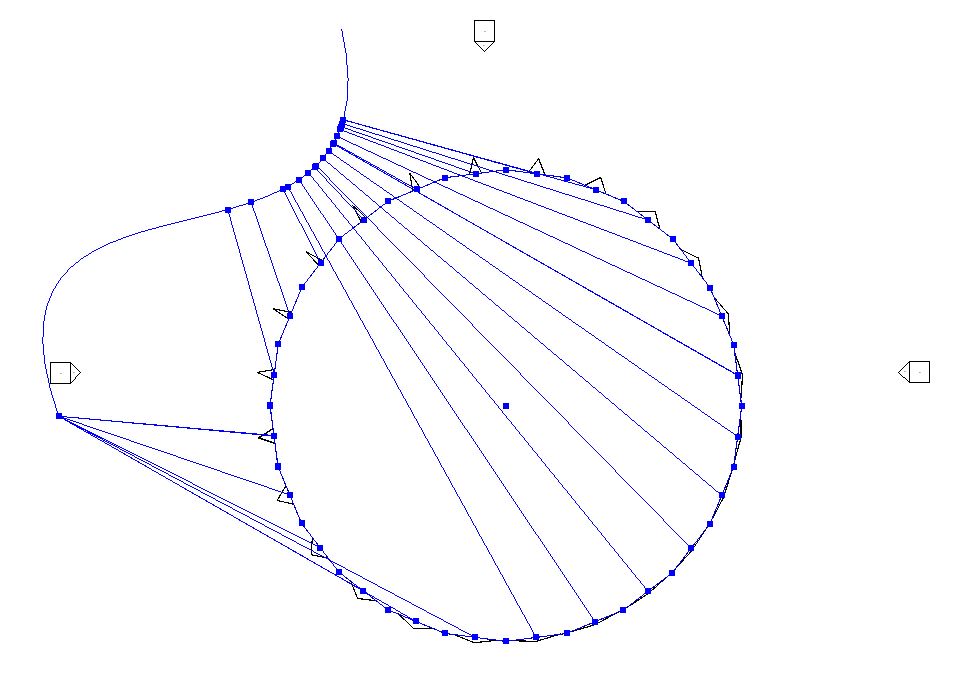
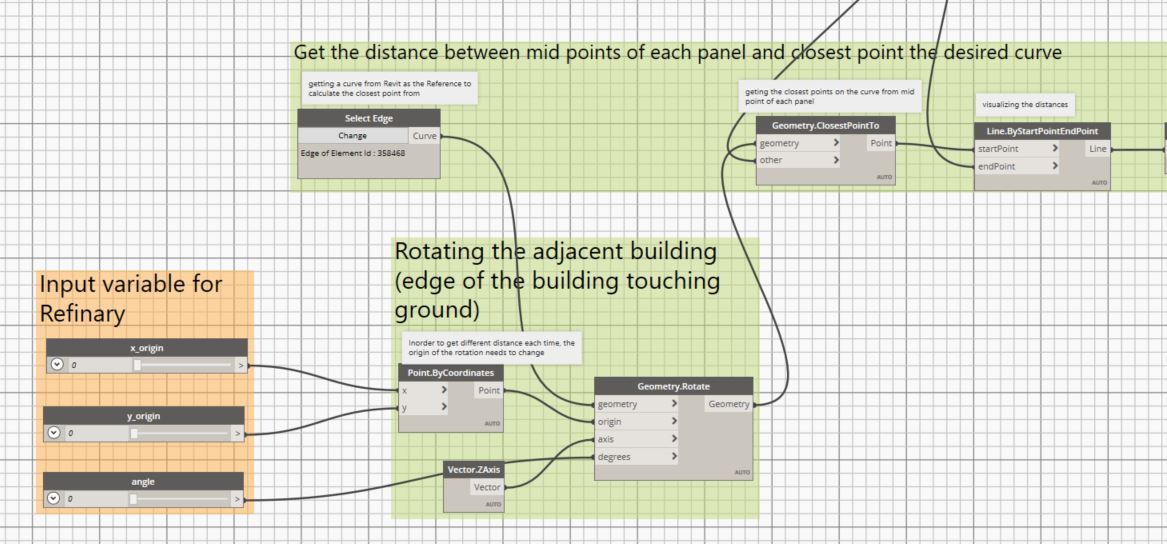
2. Use the edge of the mass model as a reference to calculate the distances between the midpoints of the panels and the closest points of the curve (building edge). In this case, I chose the edge that faces my project and touches the ground as the reference curve.


4. Use the remapped values to control the width factor of the panels
In order to get different distance values to later used for Refinery, the location of the curve changes through rotation.
3 variables are used as input:
x and y to change the origin of the rotation
angle: to change the rotation angle
Two objectives are used for Refinery:
1. Maximizing the sum value of the opening factor values
2. Minimizing the sum values of the width factor values
The project is exported for Refinery.

The optimization process is done with 48 population size and 200 generations.


These solutions show the Pareto front solutions in 200 generations regarding the defined objectives.
Any solution could be selected to be shown in the project and the corresponding variables could be extracted. The image below shows one solution selected in Refinary.

Findings:
Unfortunately the Refinary cannot show the objective space. The values of the objectives are not presented in the solutions yet.